Monitor Mode
A brief overview of active calls, previous ones and more useful information
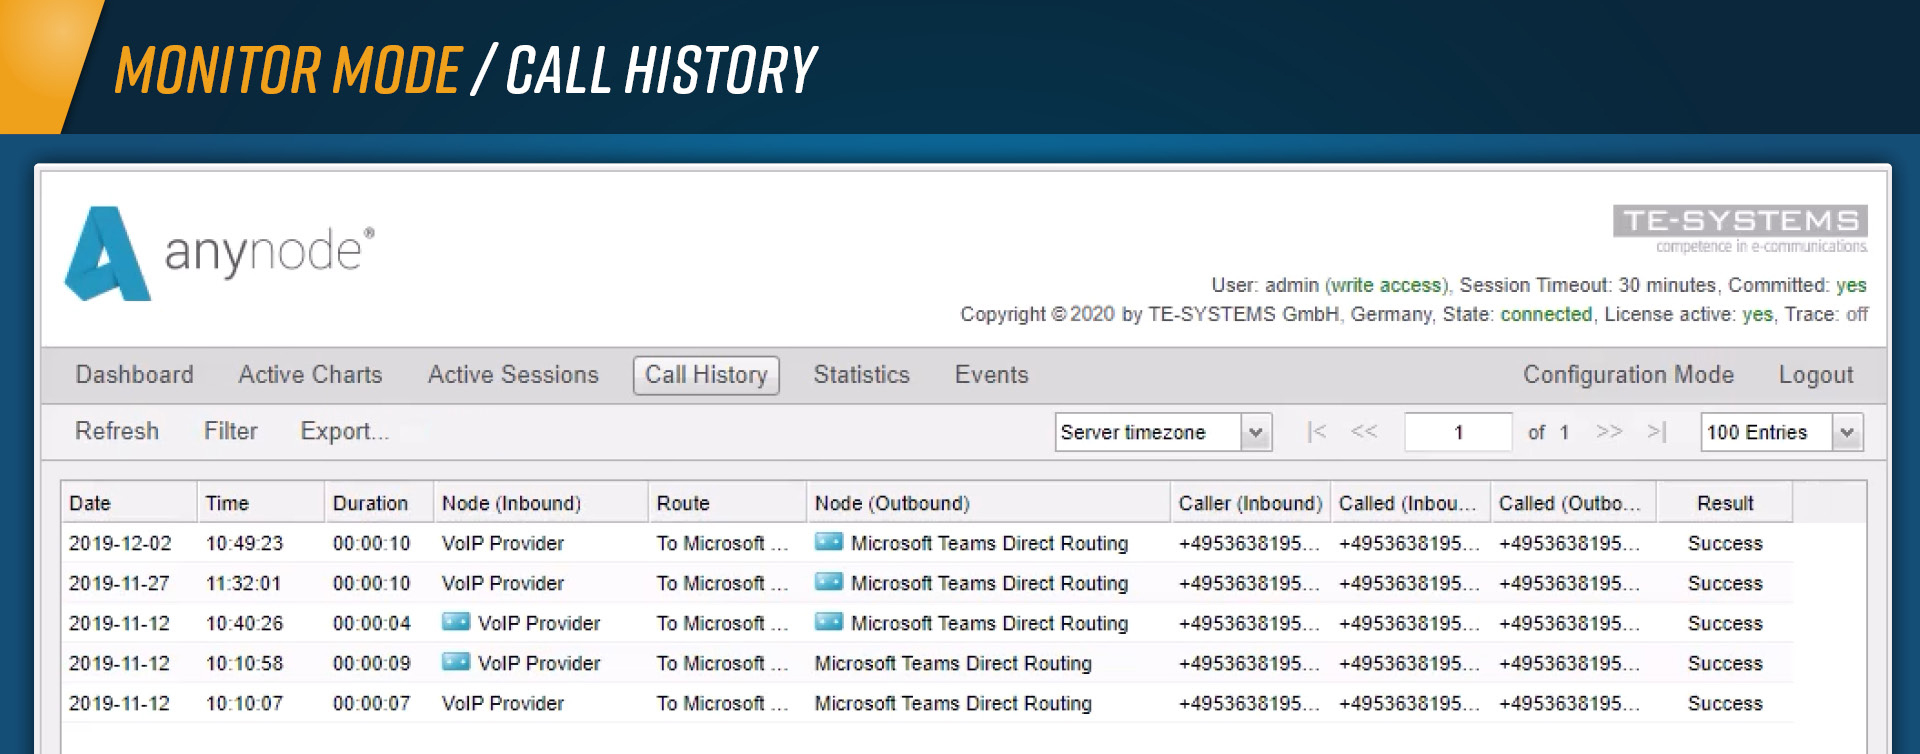
The user interface of anynode contains in addition to the configuration mode another display mode: The monitor mode. It provides a quick overview of all active calls and a logging of all previous calls with detailed information.

Call History with details of recent calls, calls with media recording are marked separately
Hover your mouse over an element and you will get additional information about used codecs or any lost packages.
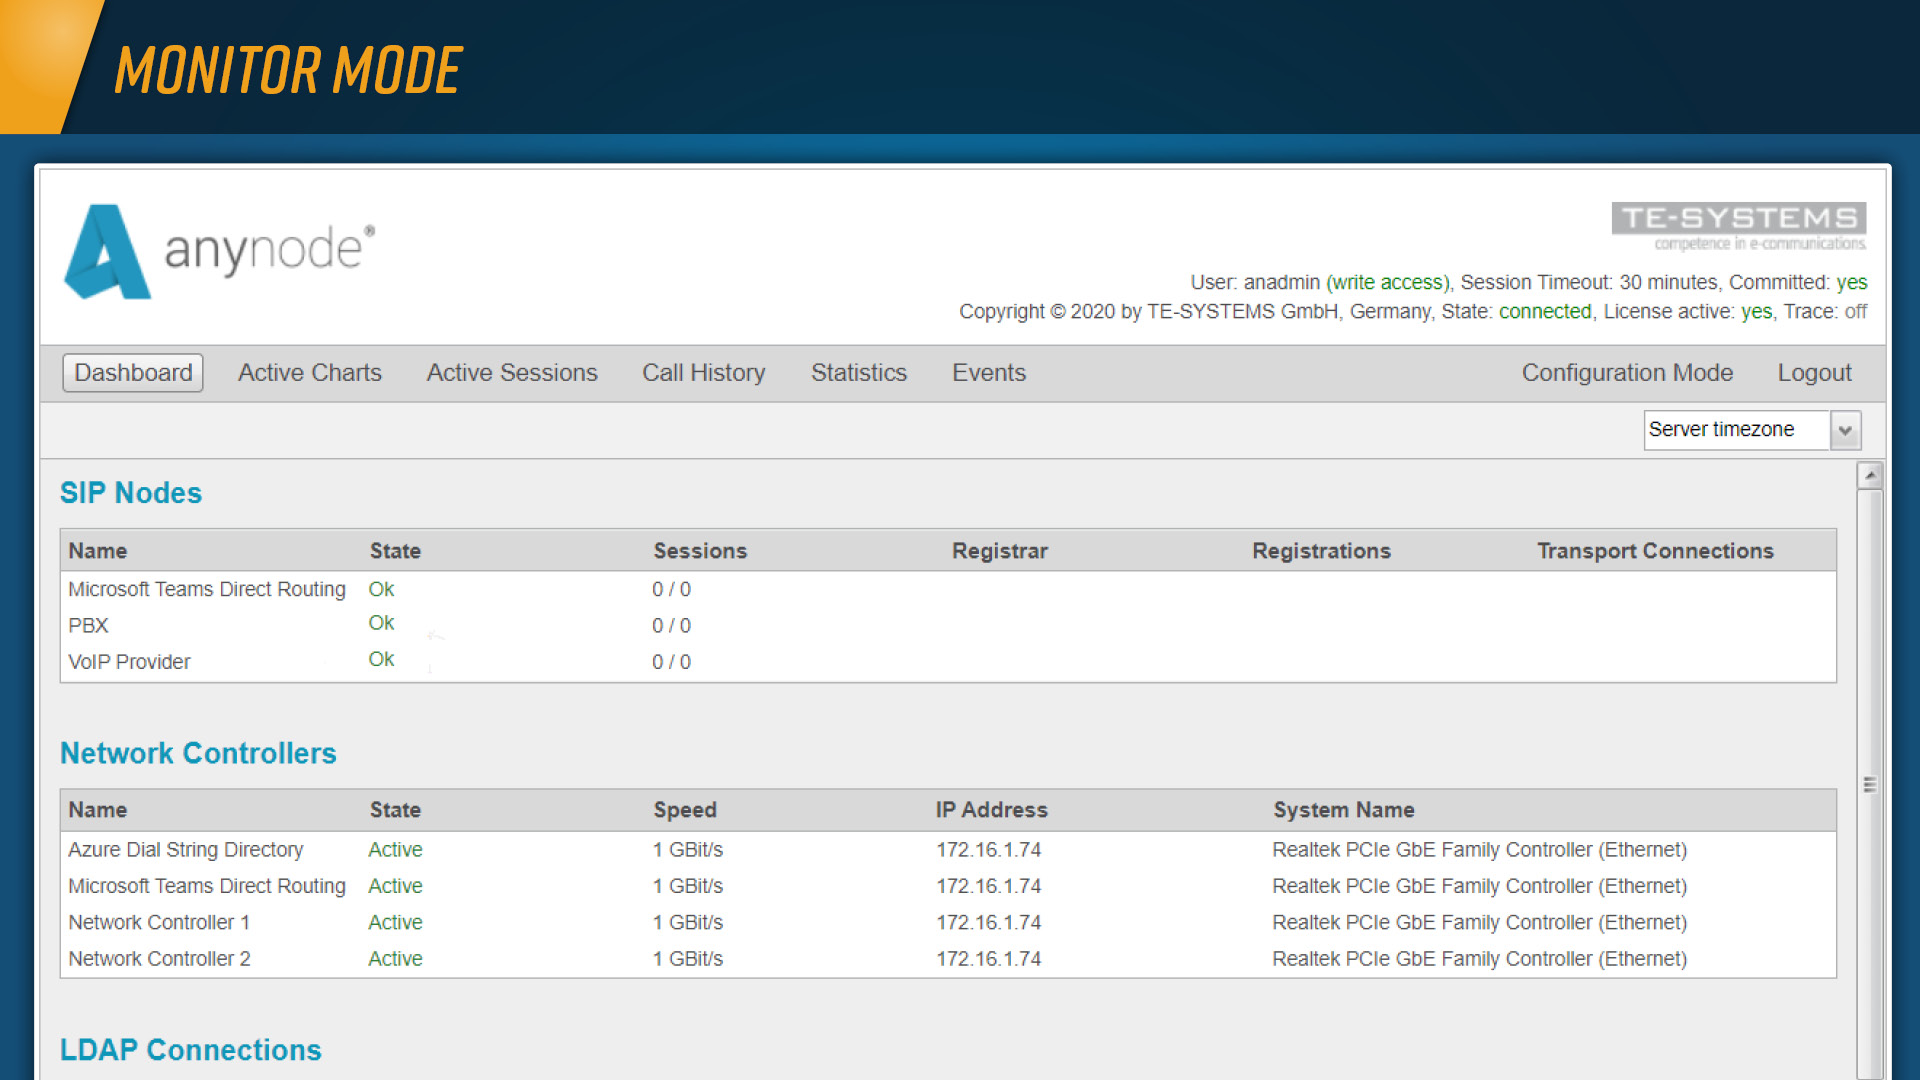
With the dashboard, you get an overview of the status of anynode showing all you need to know right away. In the system view you see the status of all your nodes. If everything is functioning normally, the status is displayed in green. If a connection has failed, the status is displayed in red.

Dashboard with a quick overview of the status of anynode
With up-to-date information, such as the state of registrations, an overview of added certificates or a look at all installed licenses, your system’s status is more transparent, allowing you to make adjustments and optimizations quickly and effectively. With a single mouseclick, all the important information on the selected element pops right up.
Become an anynode pro
and join our partner program
We offer extensive product-related workshops that guide you on the efficient use of our Software Session Border Controller. Designed for IT professionals, administrators, resellers, or system vendors who want to take full advantage of the potential of anynode.


